For better, for worse

This was the year when much was promised for Scotland – and optimism was evident more widely, until renewed economic doubts and uncertainties surfaced as some of the shine came off the UK and EU statistics.
For Scottish solicitors too, the Journal’s latest employment survey suggests an outturn not quite as rosy as expected this time last year (see table 4). In private practice, looking at how people now perceive the past 12 months as compared with their expectations a year ago, most sectors (by practice size) show a less positive/more negative view of the scene than they did before, tested by the balance of responses as to whether the outlook is now better or worse. For sole-principal practices, the net figure has again turned sharply negative, though a smaller sample in this category makes the figure perhaps less reliable.
The exception is the largest firms (21 or more principals), where a year ago 32% thought the outlook for their organisation would improve over the following 12 months, whereas 52.8% now say it has done so. Could this be the effect of cross-border mergers providing new opportunities? Or the generally improved results of our remaining Scottish-based big firms? Are other factors at work?
The effect is not repeated in the in-house commercial sector, where 36% of those working for listed companies report that the outlook has worsened in the past 12 months, against 30% who claim an improvement, leaving a negative balance that contrasts sharply with the net +27.6% who last year thought that their outlook would have improved by now. It also contrasts with the results from the private company sector, which returned a healthy positive of just under 25% – though this again is well down on the positive balance of almost 48% returned in expectations in late 2013.
Unsurprisingly, pessimism continues unabated in the public sector, where few at either national or local level see any sign of improvement, particularly those working for local bodies: 73% say the outlook has got worse over the past year and exactly two thirds expect the same in the coming 12 months (for national bodies the figures are 44% and 52.4% respectively).
Improving trends
More respondents reported headcount growth in their organisation than redundancies, reversing last year’s balance, though the difference is not huge (table 3). Pay and conditions have also shown some improvement this past year. The number reporting a pay freeze in their organisation is down 10%, from 32.5% to 22.3% (though still 46.6% in local public bodies); and 67%, against 56.3% last year, have benefited from some form of pay rise, even if for nearly half of these (30% of respondents) it was no more than 2%. (In sole-principal practices, 34.5% report a decrease in earnings; in the public sector, most report either no change or a rise below 2%.)
Satisfaction with pay (average up 4% to 67%) tends to be higher for more junior lawyers, at over 70% for those qualified for 10 years or less, compared with around 64% for more senior people. It also varies considerably with type of organisation, the lowest levels occurring with sole-principal practices (about 55%), those in the two to five principal category (below 59%) and those in national public sector bodies (below 57%) – all in contrast to the bigger firms and the in-house commercial sector, where satisfaction levels are around the 70% mark, with listed companies coming top at nearly 77%.
Satisfaction figures for benefits (average up 7% to 74%) show a similar pattern in private practice, but in the public sector are generally higher than with pay, quite possibly due to the numbers still in final salary pension schemes (over 76% for local public bodies). The commercial sector still leads the way for benefits, however, with over 90% of listed company employees regarding their packages well (here, for example, 86.5% have private healthcare cover), followed by private companies on 86.6%. For bigger law practices the satisfaction scores are in the 70-75% range; for smaller firms it is more like 55-60%.
What’s new?
Most, but not all, employers pay for practising certificates (a question we asked for the first time this year), the figures ranging from 83.5% for local public bodies and 86.2% in sole-principal practices, to 90% in the commercial sector, 95% in national public bodies and close to 100% across the rest of private practice. Another new set of questions this year explored the digital age and flexible working. We already knew that nearly two thirds (63.2%) of respondents are able to work flexible hours, in practice if not by contract – but 70% now say they can work from home if necessary. In addition, 54.2% can work on their own portable electronic device, and just under 50% can use or access social media using their employers’ IT: so we hope those employer policies regarding BYOD (bring your own device), social media use etc – frequently the subject of risk management comment – are properly in place.
Whether or not related to that, 24.6% this year (up from 19.6% last year) report that work encroaches “a lot” on their personal life (the response “Yes, sometimes” was down by the same amount to 48.3%, leaving 27.1% replying “No, not really”). It is as likely, of course, that sheer number of hours worked is having that effect – while very few are contracted to work more than 44 hours a week, 43.6% do so in practice, including nearly 12% who reckon they work more than 55 hours a week. Such encroachment appears to increase somewhat with seniority, but there is no clear correlation with size of practice, except that it does appear more likely in the biggest firms – and somewhat less likely in the public sector compared with private practice. Mixed results on this score emerge from the in-house commercial sector.
Are people looking for a change? The evolving economic picture does not appear to have made much difference to the numbers actively seeking a new job, which have remained at or near the 8% level for the past two years. But a further 37% say they would pursue a new job if the right one came up, a slight increase, reflected in a similar fall in the number who have no plans to move in the short to medium term. We should not be surprised at people deciding to have a go if they spot what looks like a good opportunity.
| Table 1. Salary concentrations by PQE (full time contracts, highest returns for each PQE group) | |||||||
| Years | £20 - <30,000 | £30 - <40,000 | £40 - <50,000 | £50 - <60,000 | £60 - <70,000 | £70 - <80,000 | >£100,000 |
| 0-2 | 29.6% | 53.1% | 11.2% | ||||
| 2-4 | 9.0% | 49.0% | 23.0% | ||||
| 4-10 | 34.1% | 26.6% | 17.9% | ||||
| 10-20 | 16.9% | 13.4% | 14.1% | 14.1% | 18.2% | 19.0% | |
| >20 | 12.6% | 15.5% | 13.6% | 14.6% | 22.9% | 18.9% | |
| Table 2. Which benefits do you currently receive? (top responses, all sectors) | |||||||
| More than 25 days’ holiday (excl public holidays) | 42.4% | ||||||
| Private health care | 31.9% | ||||||
| Life or health insurance | 28.8% | ||||||
| Smartphone/tablet | 28.1% | ||||||
| Training support (work related) | 24.5% | ||||||
| Pension:final salary | 23.9% | ||||||
| Ability to buy/sell annual leave | 23.7% | ||||||
| Childcare/creche vouchers | 23.3% | ||||||
| Cash bonus(individual performance) | 22.9% | ||||||
| Cash Bonus (firm performance) | 21.7% | ||||||
| Pension (money purchase) | 20.3% | ||||||
| Pension (stakeholder) | 18.9% | ||||||
| Pension (other) | 17.0% | ||||||
| Table 3. Has your organisation experienced any of the following over the past 12 months? (top responses, all sectors) | |||||||
| % | % change on 2013 | ||||||
| Headcount growth | 33.2 | +2.2 | |||||
| Redundancies | 29.8 | -3.4 | |||||
| Pay freeze | 22.3 | -10.2 | |||||
| Merger or takeover | 13.5 | -2.3 | |||||
| Bonuses introduced or increased | 12.3 | N/A | |||||
| Benefits reduced, suspended or scrapped | 10.5 | N/A | |||||
| Bonuses reduced suspended or scrapped | 9.7 | -12.8 | |||||
| Benefits introduced or increased | 4.5 | N/A | |||||
| Reduced working hours/days - voluntarty or compulsory | 3.1 | -1.5 | |||||
| Compulsory overtime | 1.4 | -0.1 | |||||
| Don't know | 17.2 | +2.8 | |||||
| Table 4. Better or worse? The outlook for your organisation (balance of responses, better v worse, last year’s return in brackets) | |||||||
| Over the past 12 months | predicted for next 12 months | ||||||
| Sole principal | -29.6% (0%) | -10.8% (+5%) | |||||
| 2-5 principals | +20.3% (+10%) | +20.9% (+26.8%) | |||||
| 6-10 principals | +26.7% (32.5%) | +20.0% (27.5%) | |||||
| 11-20 principals | +22.7% (28.6%) | 38.7%(35.7%) | |||||
| 21+ principals | 52.8% (+18.9%) | +42% (+32%) | |||||
| Private companies | +24.7% (+37.8%) | +26.9% (+47.8%) | |||||
| Listed companies | -6% (6.9%) | +16% (+27.6%) | |||||
| *Public sector (national body) | -40.2% | -50.5% | |||||
| *Public sector (local body) | -69.3% | -64.1% | |||||
| *Last year a single public sector category showed a balance of –58.1% for the last 12 months and –36.2% on predictions for the next 12 months | |||||||
Who took the survey?
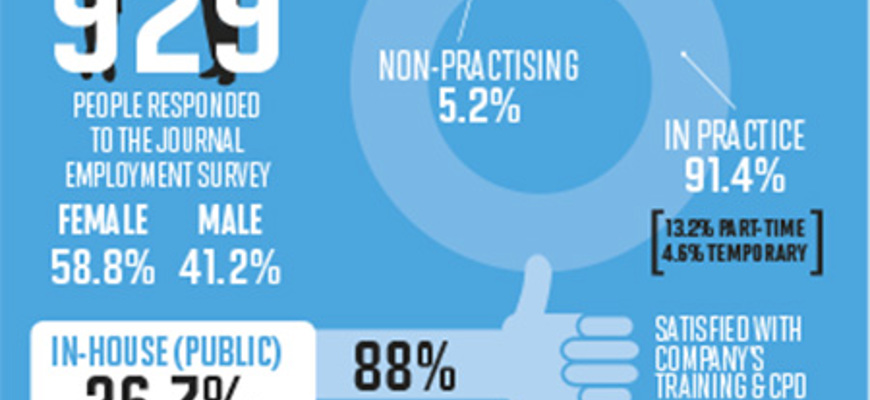
Thank you to the 929 people who responded to this year's Journal employment survey, somewhat more than last year, though the breakdown by gender (58.8% female; 41.2% male) happened to be exactly the same. In-house lawyers, at 26.7% from the public sector and 15.1% from the private sector, were somewhat overrepresented compared with the profession as a whole, but the figures enable some useful comparisons to be drawn. In all, 91.4% of respondents were in practice, 5.2% non-practising, and 3.4% not currently in employment. Of those employed, 13.2% were part time, and 4.6% (not necessarily from the same group) on temporary contracts.
Among other figures gleaned, 88% expressed themselves satisfied or very satisfied with their company's training and CPD; and over a quarter (26.4%) do not expect to take their full holiday entitlement this year. Over 80% say their employer takes part in or encourages pro bono-related activities.
For further comparisons with past years, see Journal, December 2013, 19, and December 2012, 22.
In this issue
- Factors in the balance
- Balancing the right to decide
- Life yet in oil and gas
- Commercial awareness begins at trainee stage
- Relocation and the finances of contact
- Reading for pleasure
- Opinion: Archie Maciver
- Book reviews
- Profile
- President's column
- Up and running at last
- People on the move
- With this Act, I thee wed
- Tax: a mission to inform
- For better, for worse
- Filling the Bournewood gap
- Power talking
- For whose aid?
- Balanced view
- A laughing matter?
- Directors: how much is too much, or not enough?
- Credit where it's due?
- New age, new image, new media, continuing problems?
- Scottish Solicitors Discipline Tribunal
- Lawyers as leaders
- Property Law Committee update
- Property Standardisation Group update
- Over the finishing line – 2
- Not proven no more?
- Vulnerable clients guidance now extended to the young
- From the Brussels office
- Take it to the schools
- A future – a vision
- Ask Ash
- A strategy with legs?
- Who's got what it takes?
- I can act, but should I?
- Prominence unplanned


